
A useful Google Ads report answers one question: is the money bringing leads? It does that in plain language, with four headline numbers — spend, cost per lead, click-through rate, and cost per click — compared to the prior period and broken into weekly trends. If your current report does not do that, it is not doing its job.
- Limit headline metrics to four: spend, cost per lead (CPL), click-through rate (CTR), and cost per click (CPC).
- Compare CPL to the prior period every month — a single number in isolation tells you nothing.
- Show weekly trend charts so one bad week does not hide inside a monthly average.
- Report Local Services Ads and Search separately; they behave differently and blending them hides which one is working.
- Use the same layout every month so you can compare months without relearning the format.
Why Most Google Ads Reports Fail Small-Business Owners
Most Google Ads reports fall into one of two failure modes. The first is the screenshot report: a few images from the Google Ads dashboard, emailed as a PDF, with no interpretation. The second is the data-dump report: twelve pages of tables sorted by every dimension the platform tracks, which takes a trained analyst to read. Neither version answers the question a business owner is actually asking — “Is this money working?”
The root problem is that platform-native data is designed for platform engineers, not for the people writing the checks. Google Ads will happily show you impression share, search lost impression share (budget), search lost impression share (rank), interaction rate, absolute top impression rate, and two dozen other dimensions. Some of those matter. Most do not need to appear in a monthly summary you receive on the first of the month when you have four other things on your desk.
If you are running Google Ads — Search campaigns alongside Local Services Ads — the report problem compounds. LSA data lives in a different platform interface than Search data. Many agencies either omit it or lump both sources into one total, which destroys the signal. You cannot tell what a lead costs from each source, or which one to scale.
The fix is not a fancier tool. It is a fixed structure, built around the reader — a business owner, not a media buyer.
The Checklist: How to Tell If Your Agency’s Report Is Useful
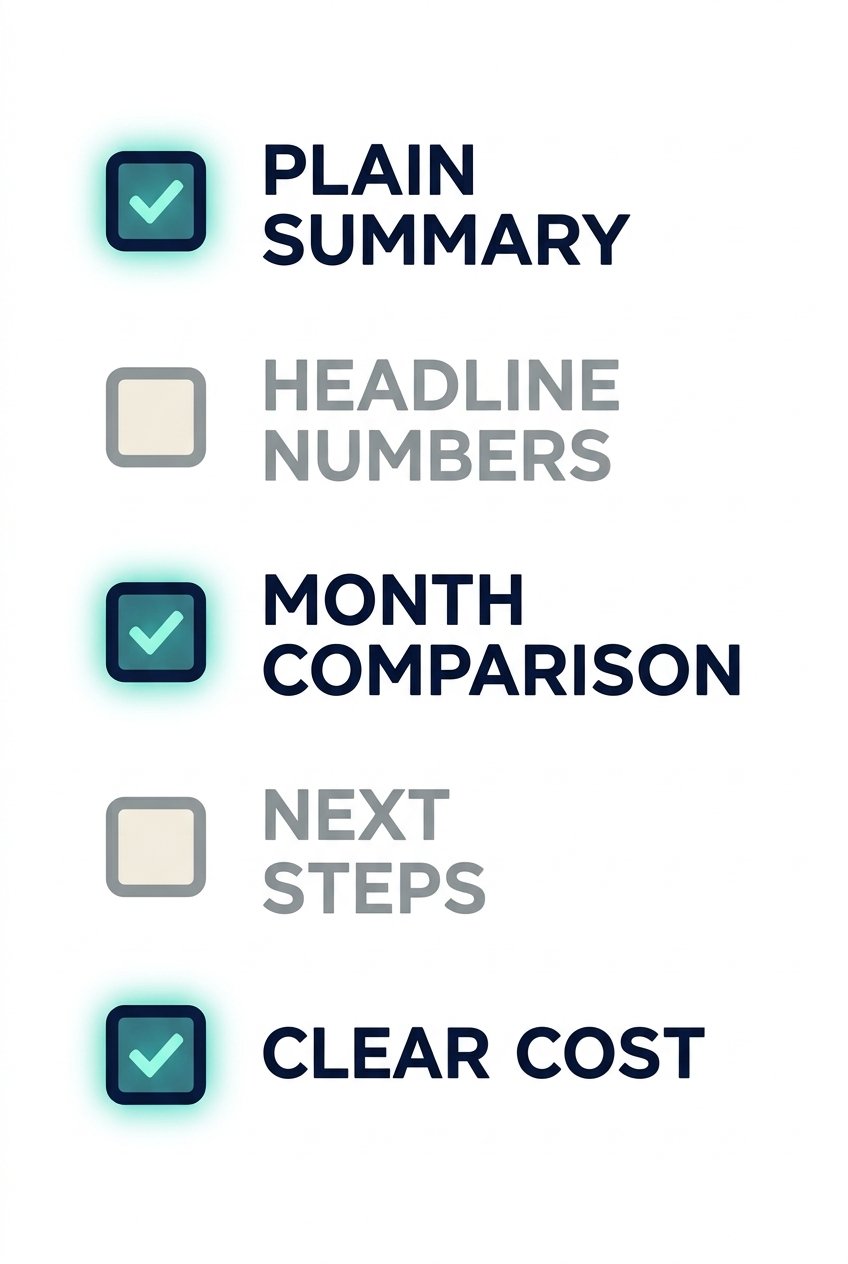
Before we show you our format, here is a quick test. Run your current report against these questions. If most answers are “no,” the report is not serving you.
- Does it open with a plain-language summary, written for someone who does not run ads for a living?
- Does it show total spend, cost per lead, CTR, and CPC as headline numbers — not buried in a table?
- Does it compare this month’s cost per lead to last month’s?
- Does it show trends by week, not just a monthly total?
- Does it separate Local Services Ads from Search?
- Does it end with specific recommendations for the next month?
- Does it look identical every month so you can compare without relearning the layout?
If you want someone to run and report on your campaigns with this standard, our Google Ads management service is built around exactly this kind of accountability. No dashboard screenshots, no agency-speak summaries.
If your monthly report does not show cost per lead — or shows clicks but never connects them to conversions — you are paying for a reporting service that cannot answer the one question that matters: are the leads coming in, and what do they cost?
Start with a Plain-Language Executive Summary
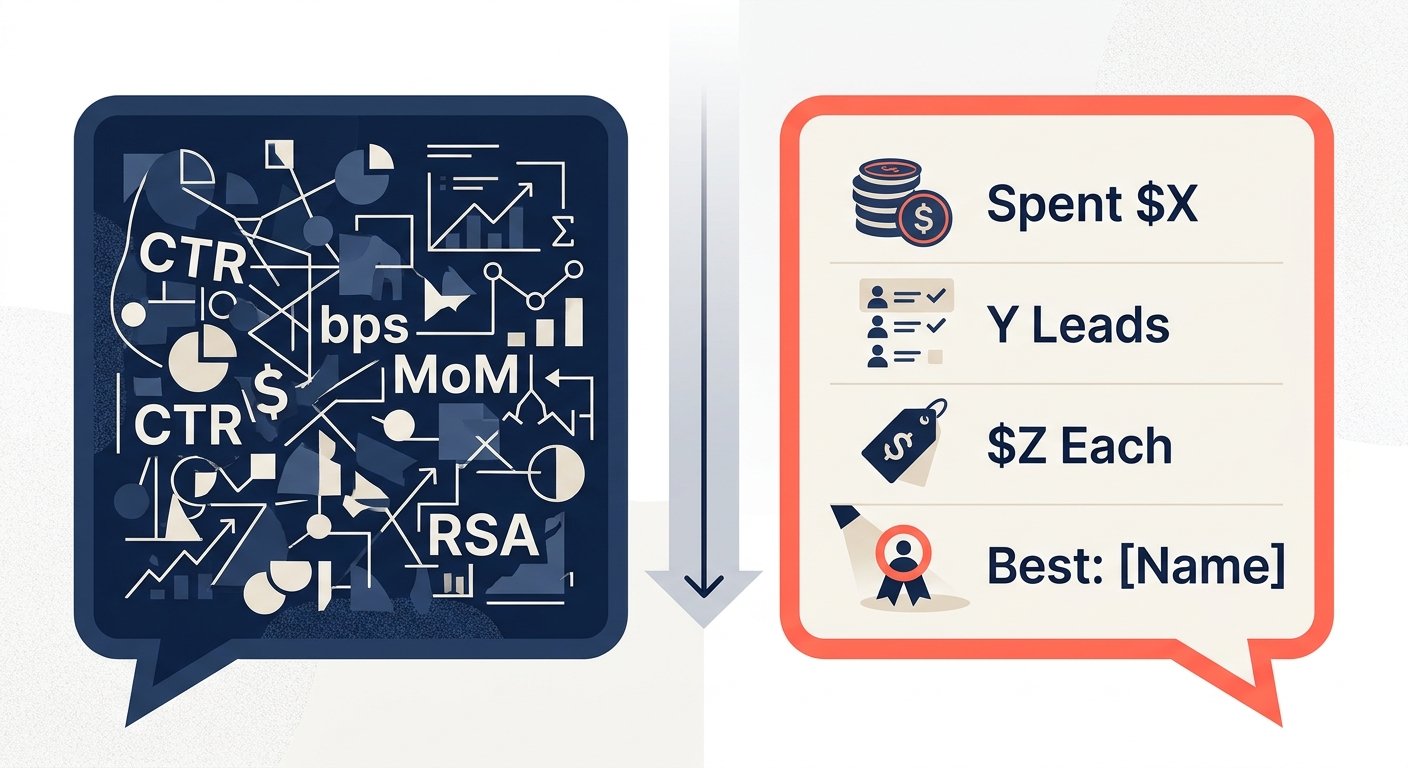
The first section of every monthly report should be a short paragraph — three to five sentences — written as if you were explaining the month to a colleague over coffee. Not “CTR improved 14 bps MoM driven by RSA asset rotation,” but “We spent $X this month. You received Y leads at a cost of $Z each. That is better than last month, when leads cost $A. The best-performing campaign was [name]. Here is what we are doing next.”
That is it. The rest of the report is the supporting detail for anyone who wants to dig in. The executive summary is the answer; everything below it is the proof.
We standardized this section across all of our accounts because we found that business owners who got a plain-language paragraph first actually read the rest of the report. When the first thing they saw was a table, they sent it to a drawer.
Four KPIs That Matter: Spend, Cost Per Lead, CTR, and CPC
There are four numbers that belong on the KPI card row at the top of a Google Ads monthly report. Four, not fourteen.
| KPI | What it tells you | Warning sign |
|---|---|---|
| Total spend | How much of the budget was actually used | Consistent underspend means targeting is too narrow |
| Cost per lead (CPL) | What one conversion costs — the core efficiency metric | Rising CPL without rising lead quality is a problem |
| Click-through rate (CTR) | Whether the ad copy is relevant to the search query | Low CTR on exact-match terms means ad copy is off |
| Cost per click (CPC) | Auction competitiveness and bid efficiency | CPC rising while CTR falls = losing auction share |
Each of those four gets its own card — a big number with the label underneath. No charts in the KPI row. Charts come in the trend section. The KPI row is the snapshot; the trend section is the story.
We do not include impressions, impression share, quality score, or interaction rate in the headline row. Those belong in the detail tables for campaigns that need diagnosis. When every metric is a headline metric, none of them are.
If you are being asked to approve a budget increase and you cannot quickly find cost per lead in your report, that is a structural problem — not a data problem. Push back and ask for it to be a headline number before you approve anything.
Compare Cost Per Lead to the Prior Period and Read Weekly Trends
A cost per lead in isolation is meaningless. $80 per lead sounds bad if you expected $40 and good if last month was $120. That is why the monthly report must show a side-by-side: this period vs. last period, for CPL specifically.
We surface this as a delta card — the CPL this month, the CPL last month, and an arrow showing direction. Green is not always good; red is not always bad. But without the comparison, you cannot have an intelligent conversation about whether the account is improving.
Weekly trend charts serve a different purpose. A monthly average can mask a significant problem. If week one and week two were strong and weeks three and four collapsed — maybe a competitor ran an aggressive promotion, maybe a landing page broke, maybe a keyword started matching junk queries — a monthly average will average the problem away. Weekly bars make the anomaly visible the moment you look at the chart.
According to Search Engine Land’s reporting best practices, week-over-week trend visibility is one of the most commonly missing elements in agency reports delivered to non-technical clients. That matches what we see.
Break Out Local Services Ads and Search Separately
Local Services Ads and Google Search campaigns are two different products. LSA charges per lead, not per click. LSA leads are phone calls or messages that Google pre-qualifies against your business category. Search campaigns charge per click and require your own landing page to convert that click into a lead. The platforms, the bidding mechanics, the lead quality, and the cost structure are different.
If you blend them into one “Google” total, you lose the ability to answer the questions that matter: Which source is delivering leads? What is the CPL from each? If the budget needs to shift, which direction?
Our reports treat LSA and Search as separate sections with their own KPI cards and their own detail tables. A client running both sees at a glance that, for example, LSA is delivering leads at one cost and Search at another — and we make a recommendation on what to adjust based on that split, not on a blended average that obscures it.
If you blend Local Services Ads and Search into one total, you cannot tell which one is actually producing leads.
Our Monthly Report Format, Section by Section
We standardized our monthly report into seven fixed sections. The order does not change month to month. When the format is identical every month, a business owner can go straight to the section they want without reorienting themselves each time.
Executive summary
Three to five sentences in plain language. Spend, leads, CPL, and the single most important thing that happened this month.
KPI cards
Four headline numbers: spend, CPL, CTR, CPC. Large format, one number per card, current month only.
Prior-period CPL comparison
This month vs. last month, side by side, with a direction indicator. No context needed; the comparison speaks for itself.
Weekly trend charts
Spend, leads, and CPL plotted by week. One bad week is visible here — not averaged away in the monthly totals.
Campaign detail tables
Full breakdowns by campaign: impressions, clicks, CTR, CPC, conversions, and CPL. This is the diagnostic layer.
LSA vs. Search breakdown
Separate KPI cards and tables for each source. Both lead types, neither obscured by the other.
Recommendations
A short bulleted list of what we are doing next month and why. This is the most skipped section in most agency reports. We make it mandatory.
We generate reports in both light and dark versions — same data, same layout, different visual skin. Clients who want to share the report with their team or use it in an internal review can use the version that fits their brand and context.
Reports are shared as a link. By default, anyone with the URL can open it. If you want your report to require a login or remain private, ask us to configure that before we share the first one. It is not automatic.
For businesses evaluating how reporting fits into a broader marketing strategy, it is worth reading how micro-moment marketing and real-time intent signals change how you read campaign data month to month.
Who Can See the Report, and Your Next Step
One thing we tell every client upfront: the report link we send is open by default. Anyone who has the URL can view it. We mention this not as a formality but because we have seen agencies share reports that contained sensitive competitive data — monthly spend, lead volume, conversion rates — via a link that went to an assistant, who forwarded it to a vendor, who was connected to a competitor. That is a real scenario.
If you want the report restricted to specific people, tell us. We set that up before the first report goes out, not after.
Our co-founder, Damon Delcoro, co-runs Security Camera King, a $25M+ a year online store. Everything in our reporting approach comes from running real accounts with real money on the line — not from a template we downloaded and branded. When we built this seven-section format, it was because we needed it ourselves first.
We manage Google Ads for businesses in Boca Raton, West Palm Beach, Fort Lauderdale, and Miami. We also work with clients nationwide through our local service business programs, particularly in industries where lead cost and lead quality are not optional — they are the entire business model.
If you are interested in how paid media connects with organic search performance, our team’s experience with both channels is documented in our published case studies. Real accounts, real numbers, no composites.
For context on how paid social compares to Search as a lead channel, the 2026 breakdown of small business paid social is worth reading alongside this one.
Frequently Asked Questions
What should be included in a monthly Google Ads report?
A monthly Google Ads report should include a plain-language executive summary, four headline KPI cards (spend, cost per lead, CTR, CPC), a cost-per-lead comparison to the prior period, weekly trend charts, campaign detail tables, a separate breakdown of Local Services Ads versus Search, and a short recommendations section. That structure answers the only question that matters: is the money producing leads?
How often should I get a Google Ads report?
Monthly is the right rhythm for most small businesses. It is frequent enough to catch problems before they compound and spaced far enough apart that the data is statistically meaningful. The critical requirement is that the format is identical every month — same sections, same layout — so you can compare months at a glance without relearning how to read the report.
What is a good Google Ads report template?
A good template has a fixed structure: executive summary, four headline KPI cards, prior-period cost-per-lead comparison, weekly trend charts, campaign detail tables, an LSA-versus-Search source breakdown, and a recommendations section. The template should not change from month to month. Consistency is what makes comparison possible.
Why report Local Services Ads separately from Search?
LSA and Search are structurally different products. LSA charges per lead; Search charges per click. They use different bidding mechanisms, serve in different placements, and attract different intent levels. Blending them into a single “Google” total hides the cost per lead from each source and makes it impossible to know which one to scale or which one to cut.
Is my Google Ads report private if it is shared as a link?
Not automatically. At UltraWeb Labs, reports are shared as links that anyone with the URL can open by default. If you want your report restricted to specific viewers, request that configuration before the first report is sent. Assume a shared link is public until you have explicitly confirmed otherwise with your agency.
Get a report that actually answers your questions
Book a call and we will review your current Google Ads report and tell you exactly what it is missing — no pitch deck, no obligation.

Skyler Libkie
Skyler Libkie joined UltraWeb Labs in 2022 and leads web design and SEO for the agency, building and ranking websites for South Florida businesses. UltraWeb Labs is an engineering-led web design and SEO agency in Boca Raton. Our co-founder, Damon Delcoro, co-runs Security Camera King, a $25M+ a year online store. More about Skyler →